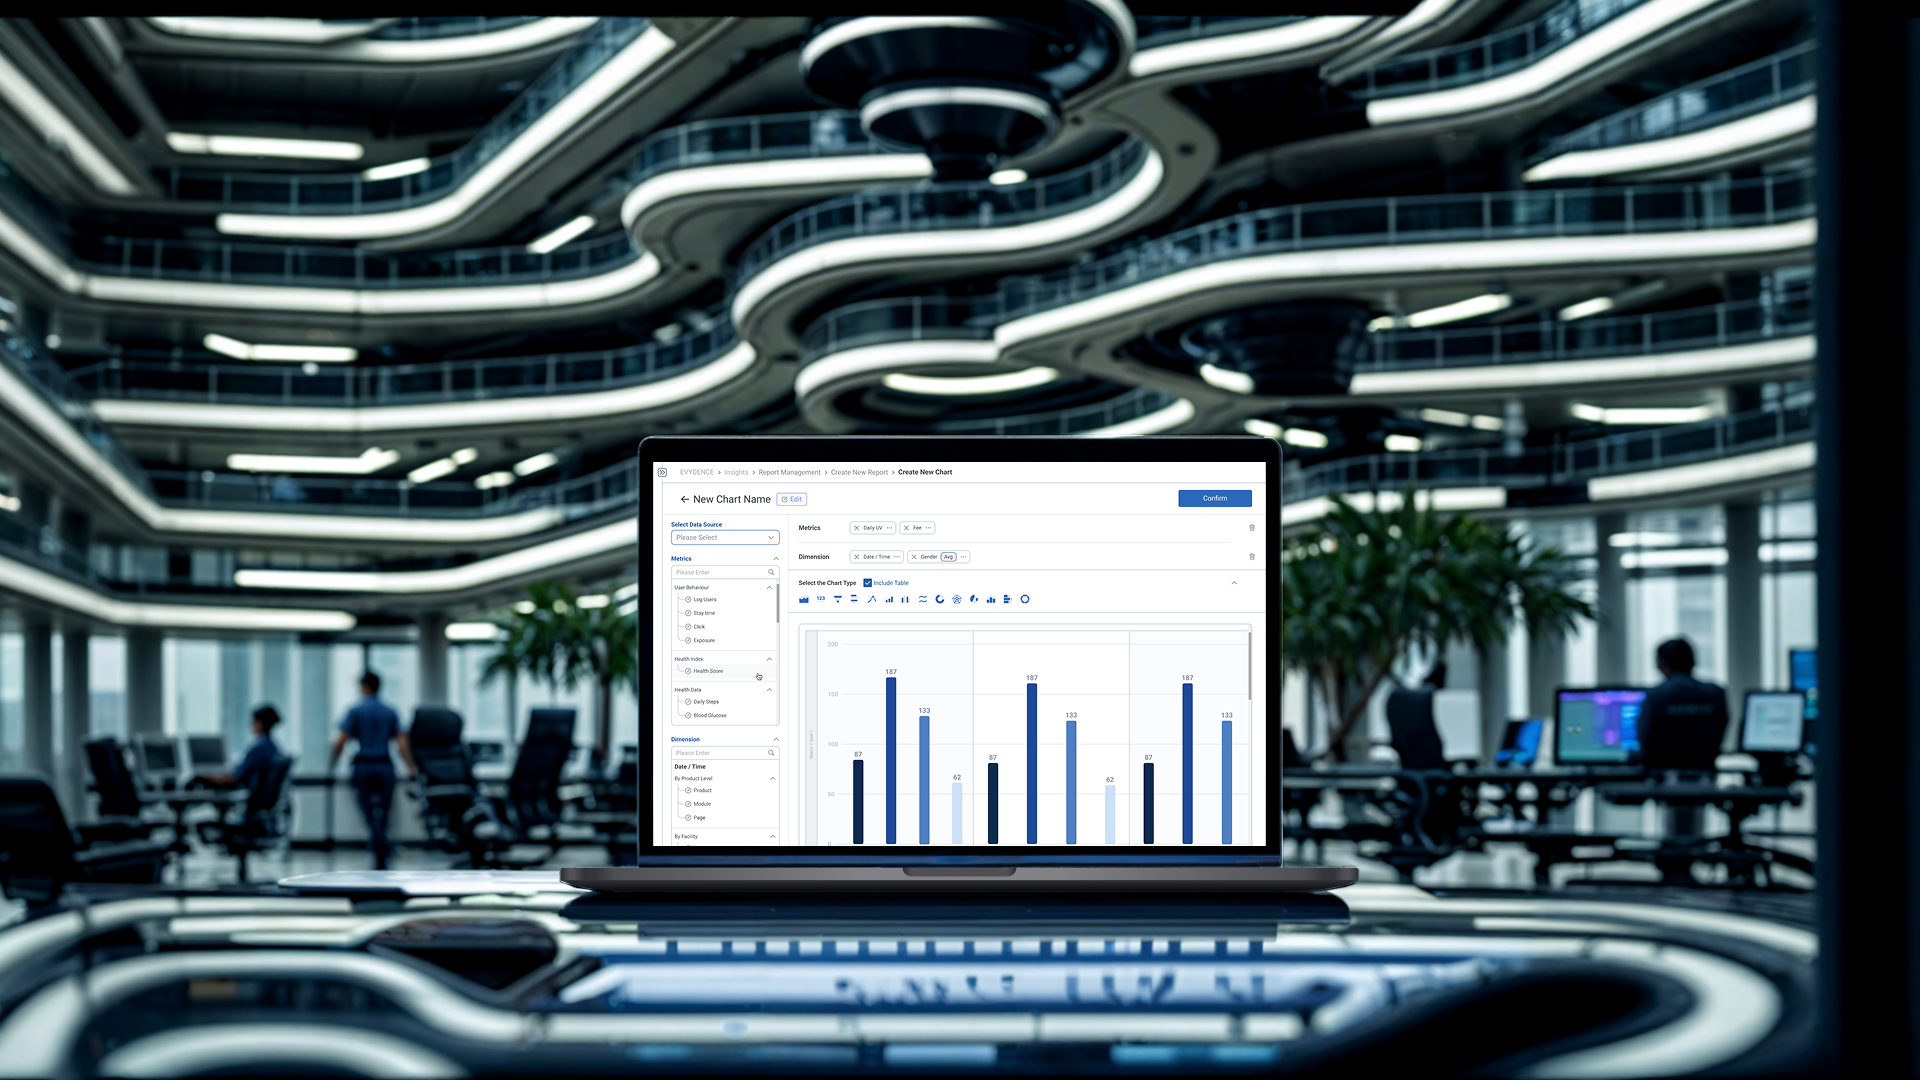
Insights Platform
Enabling Internal Users and Clients to deliver customisable dashboards at scale, all in one platform.
Tools
- Figma / Figjam
Role
- UX Research & Design
- Data Visualization Design
- User Journey Mapping
Team
- 1 Designer
- 2 Product Managers
- 2 Developers
The problem
Customer Success Managers, Data Analyst, Product Managers and Data engineers do not have a holistic platform to extract, categories and visualise data insights; they are doing manual extraction, hours of communication, and repetitive extractions that takes up 3 departments resources.
The solution
Create a holistic platform that can extract data from database, clean dirty data and present it in a dashboard for internal users and clients to use.
Approach
How was this done?
When I was approached by ops director with this situation, we sat down together a developed a process that will identify what needs to be done.
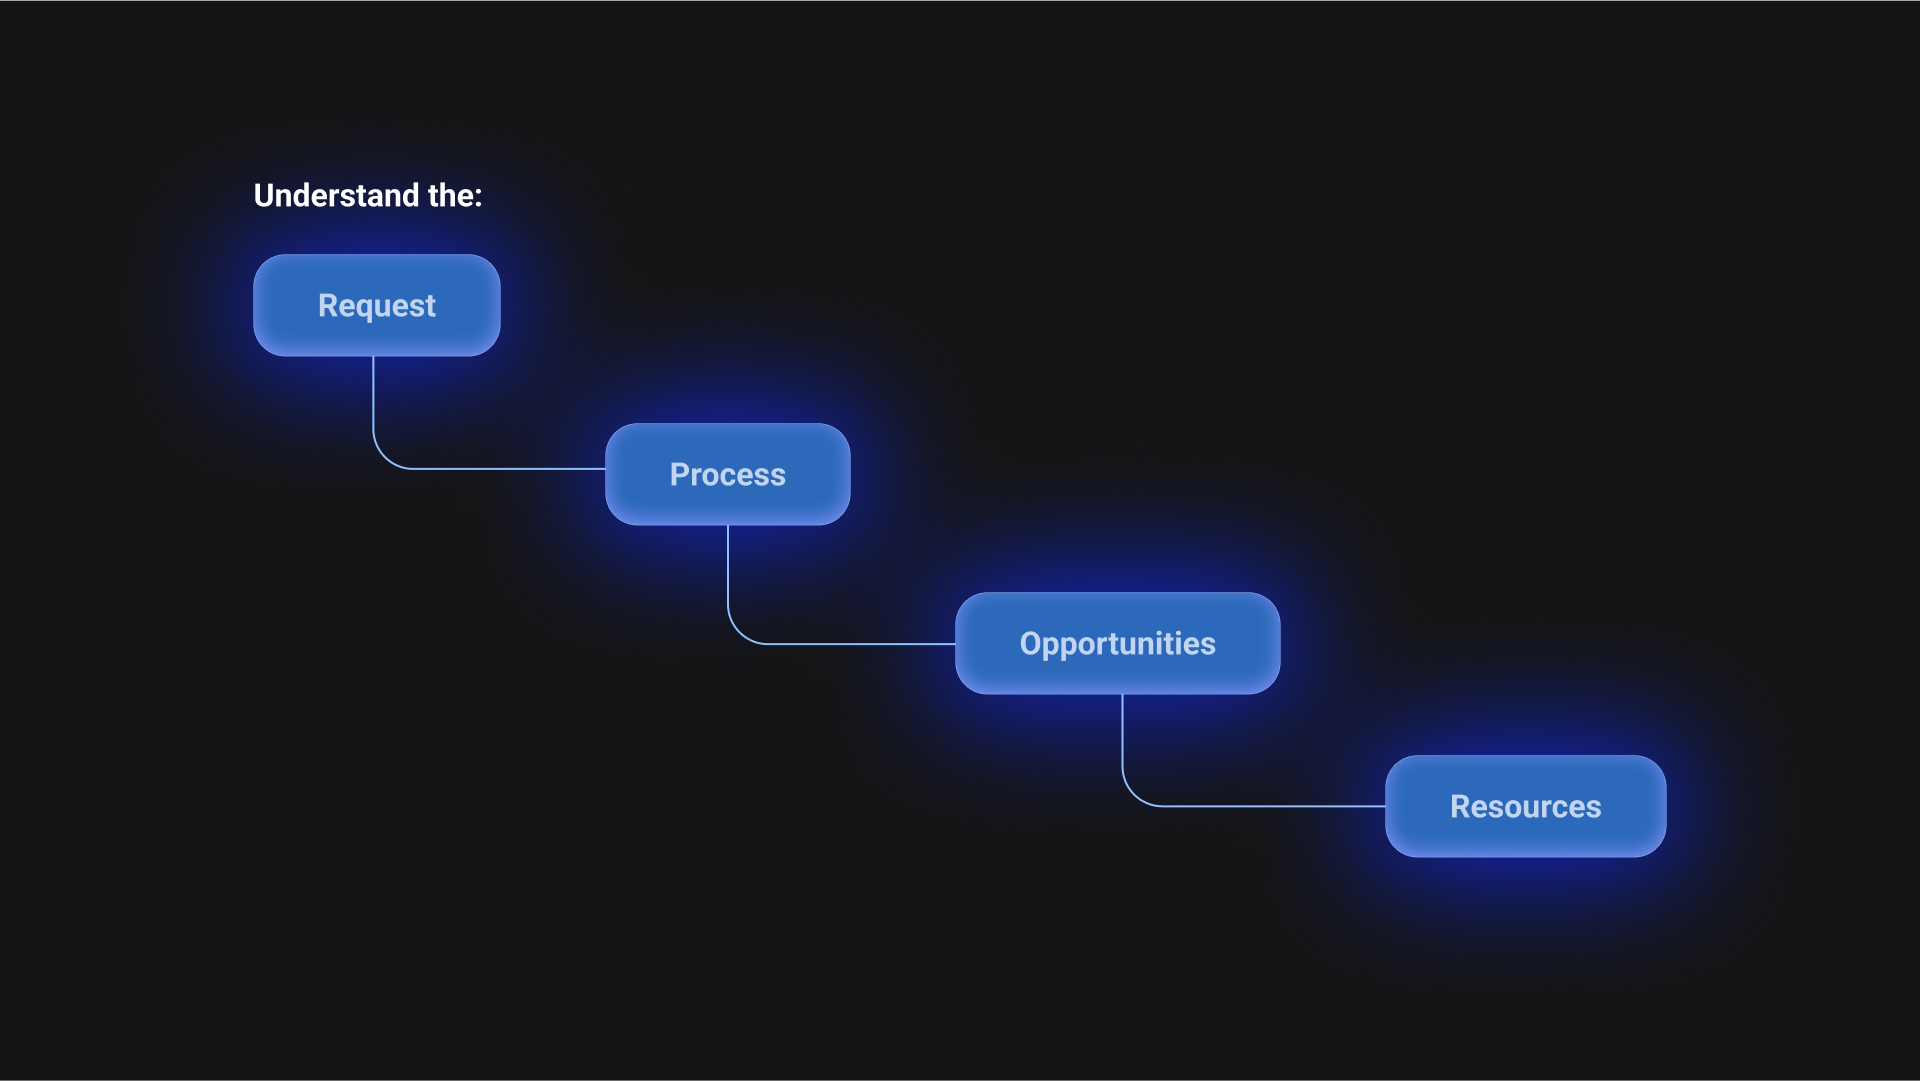
Designing with an end in mind
1
Clients wants to see, use specific data dashboard based on their needs for reporting purposes, they have many departments with multiple requests coming in frequently.
2
Understand each touch points of the long and manual process of how the teams receive and deliver these requirements.
3
See how these requirements are being communicated, manually implement and delivered from the client success teams to the development teams
4
Lastly, see how each work, handover processes, communication channels can be improved, automated or reduced by designing a holistic platform.
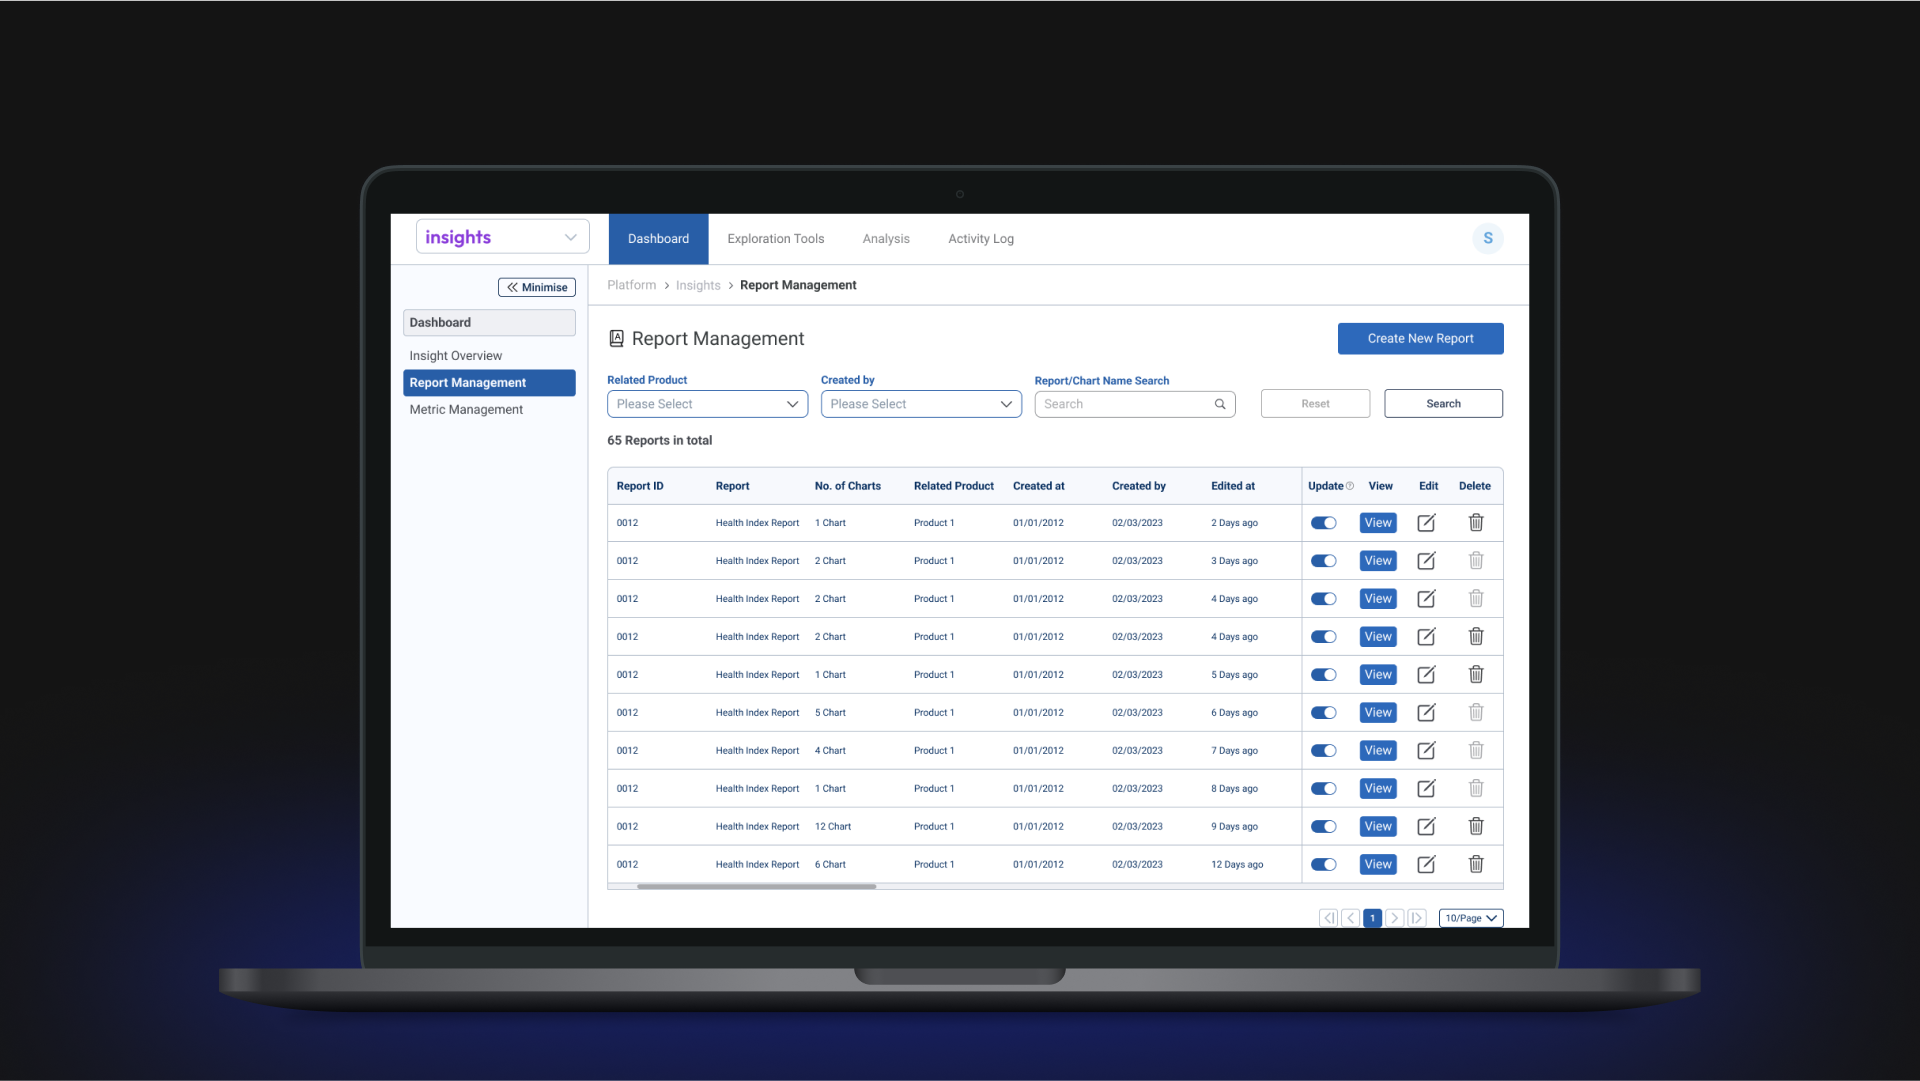
Outcome
Designed a holistic platform, streamlined department’s communication channels, improved to reports delivery and most importantly no more manual hard coding for my poor development team.
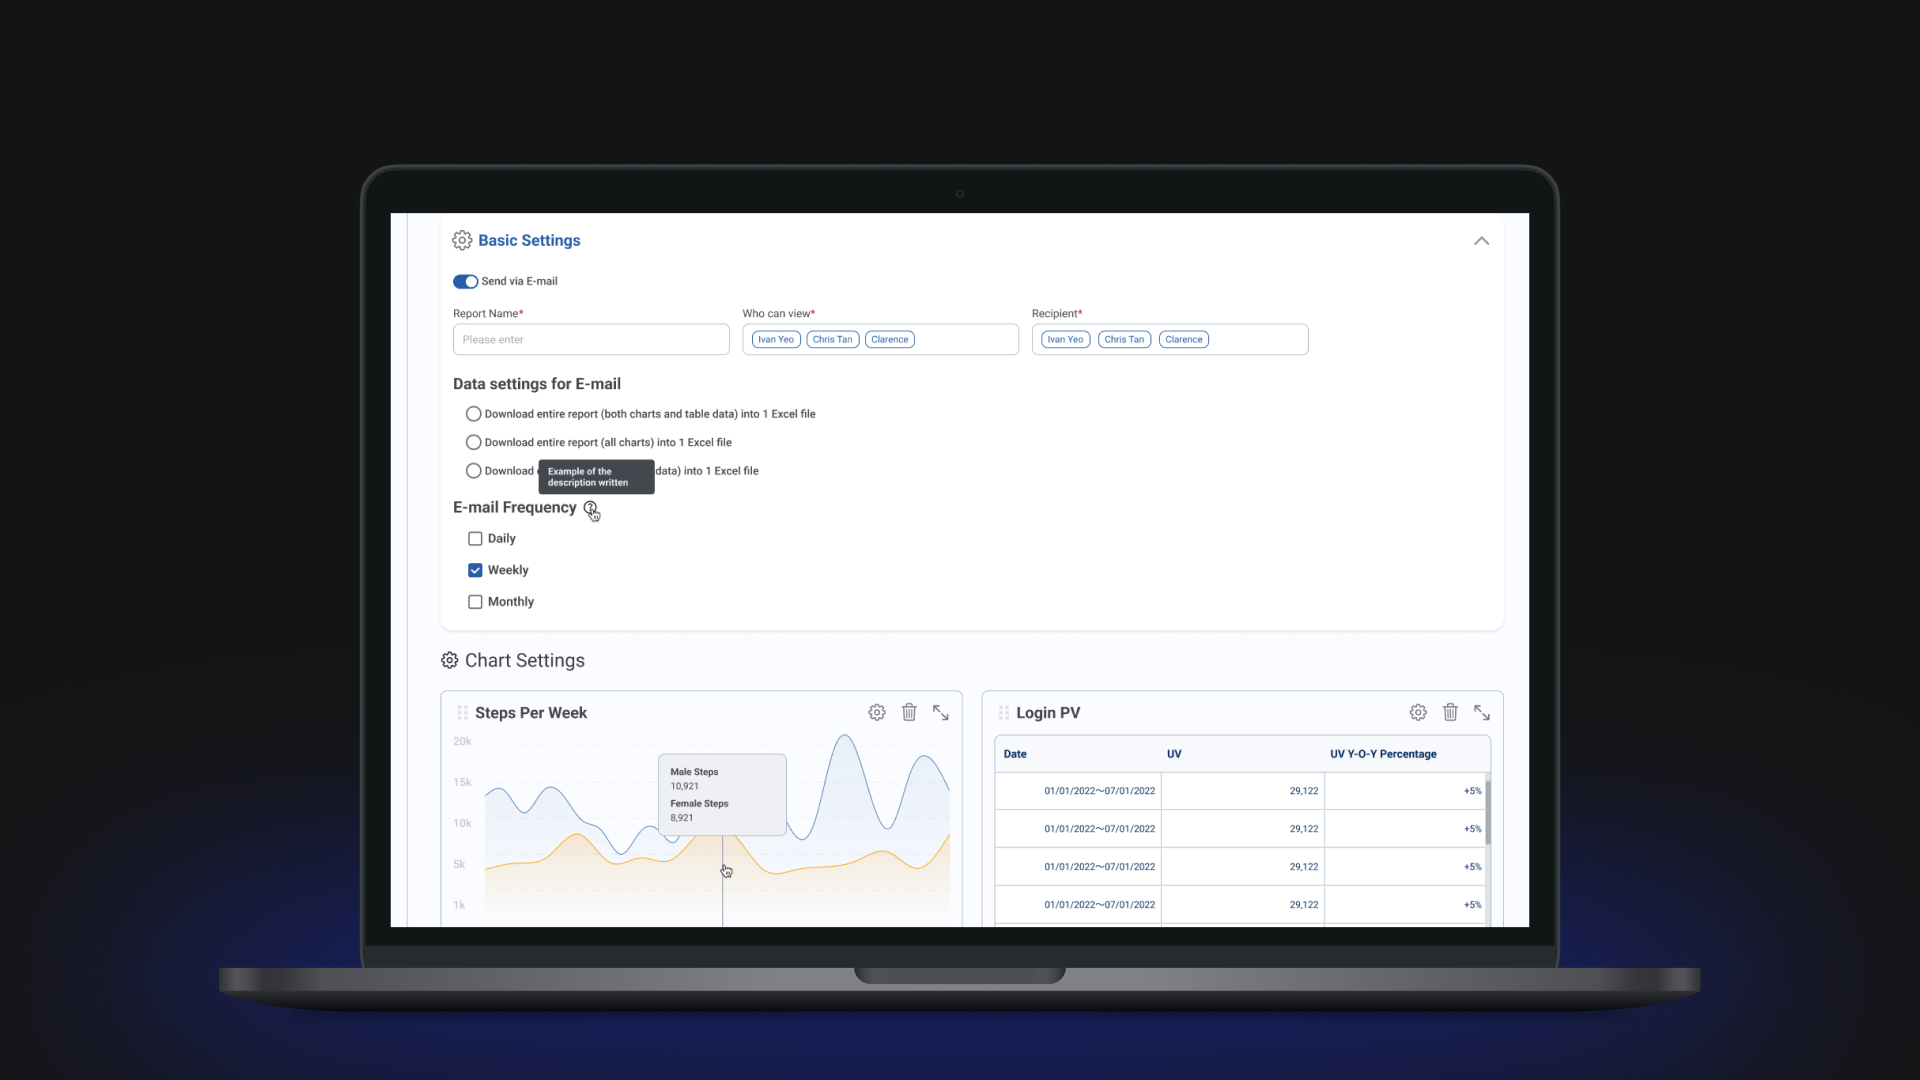
Product Manager's Struggle
Product managers have to manually gather requests from Client Success managers, then bring it’s request to developers to develop it in hard code. When there is a change request with little to no extension, extra resources were on the topic during meetings making it a struggle to move forward negotiations or new business.
How it helped
Product managers can seamlessly manage incoming requests, handover requirements and changes at scale within the platform at ease.
Data Analyst's Struggle
The Data Analyst Team had roadblocks where they are unable to extract secure data from the client’s database if they use 3rd party tools to create charts.
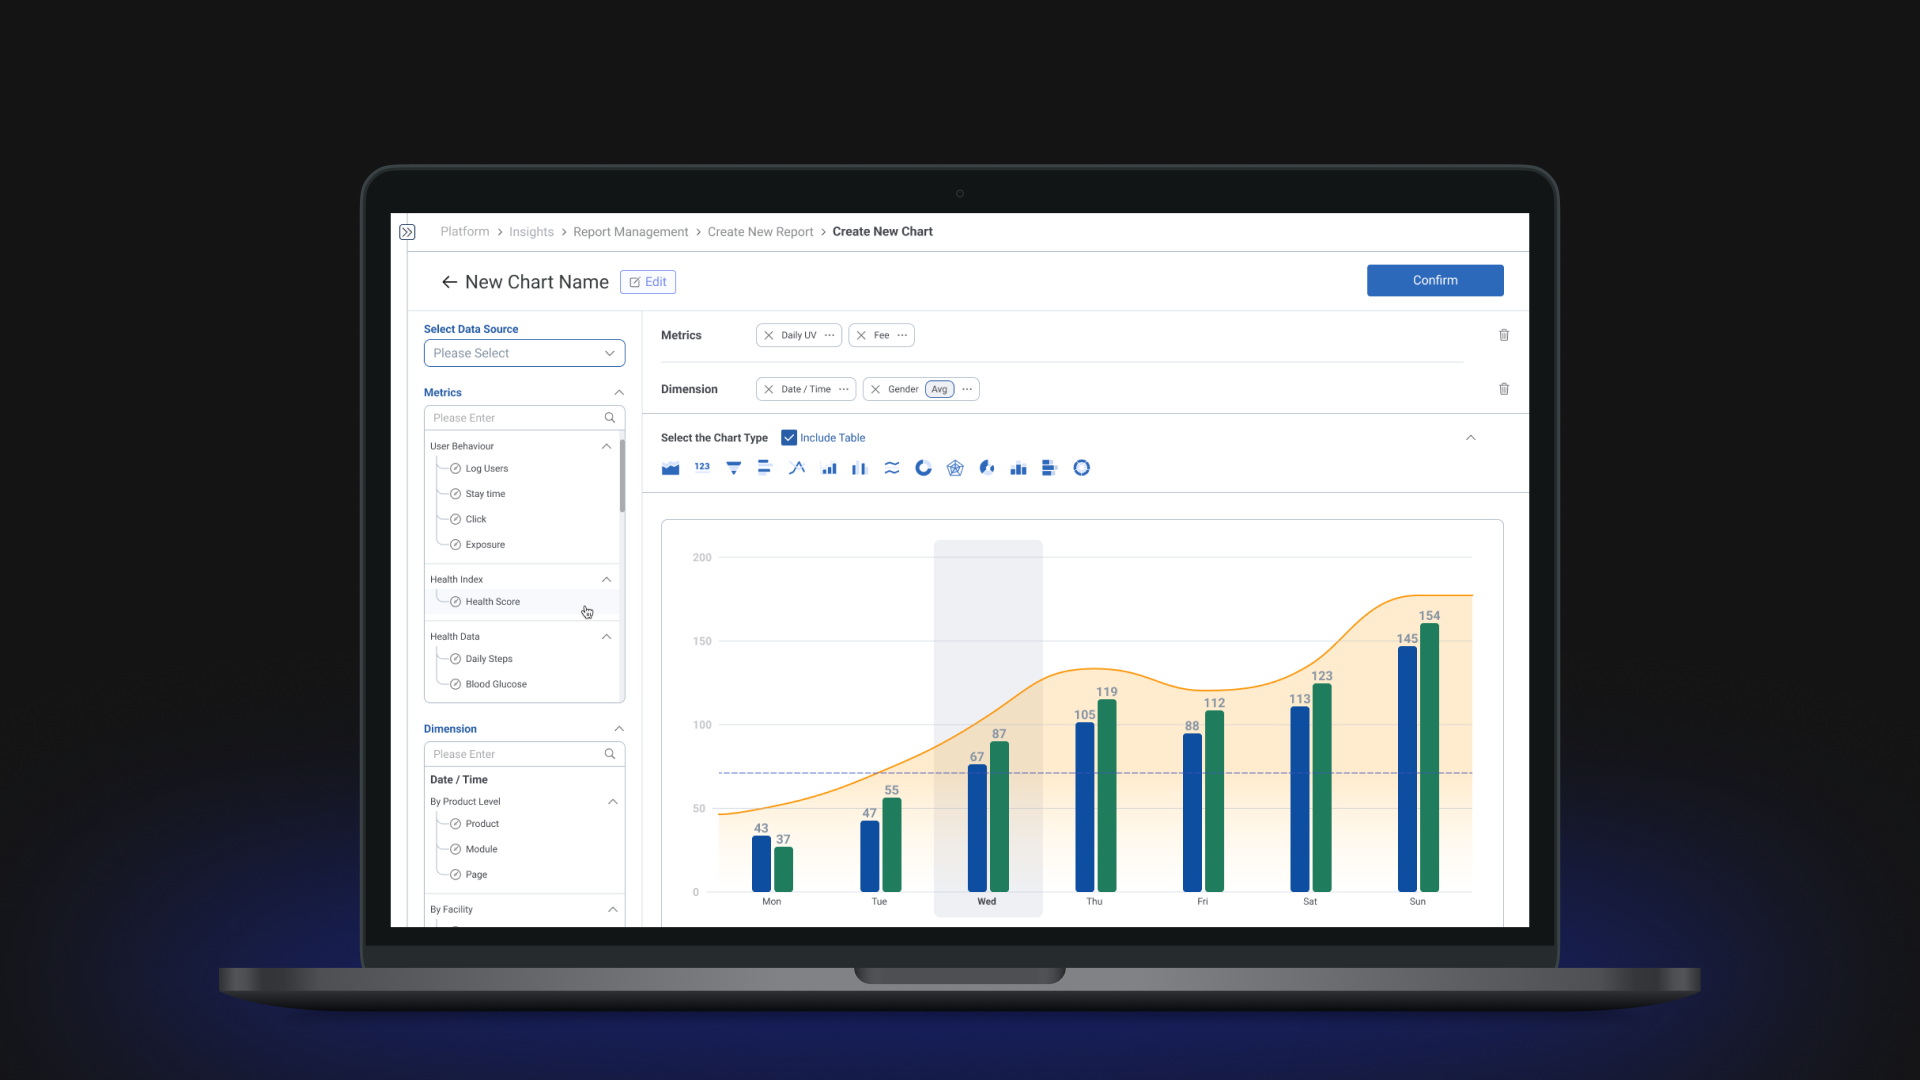
How it helped
Data Analyst can easily pull, extract data, edit in SQL editor to create clean data to make charts, making the handover process simple.
Customer Success's Struggle
Customer Success were spending too much manual time generating charts from 3rd party tools, making long static presentation decks for clients. They have to repeat this gruesome process when data parameter given has changed.
How it helped
Being able to generated charts and dashboards allows them so much flexibility, even with last minute changes. This has improved their work process to almost twice as fast.
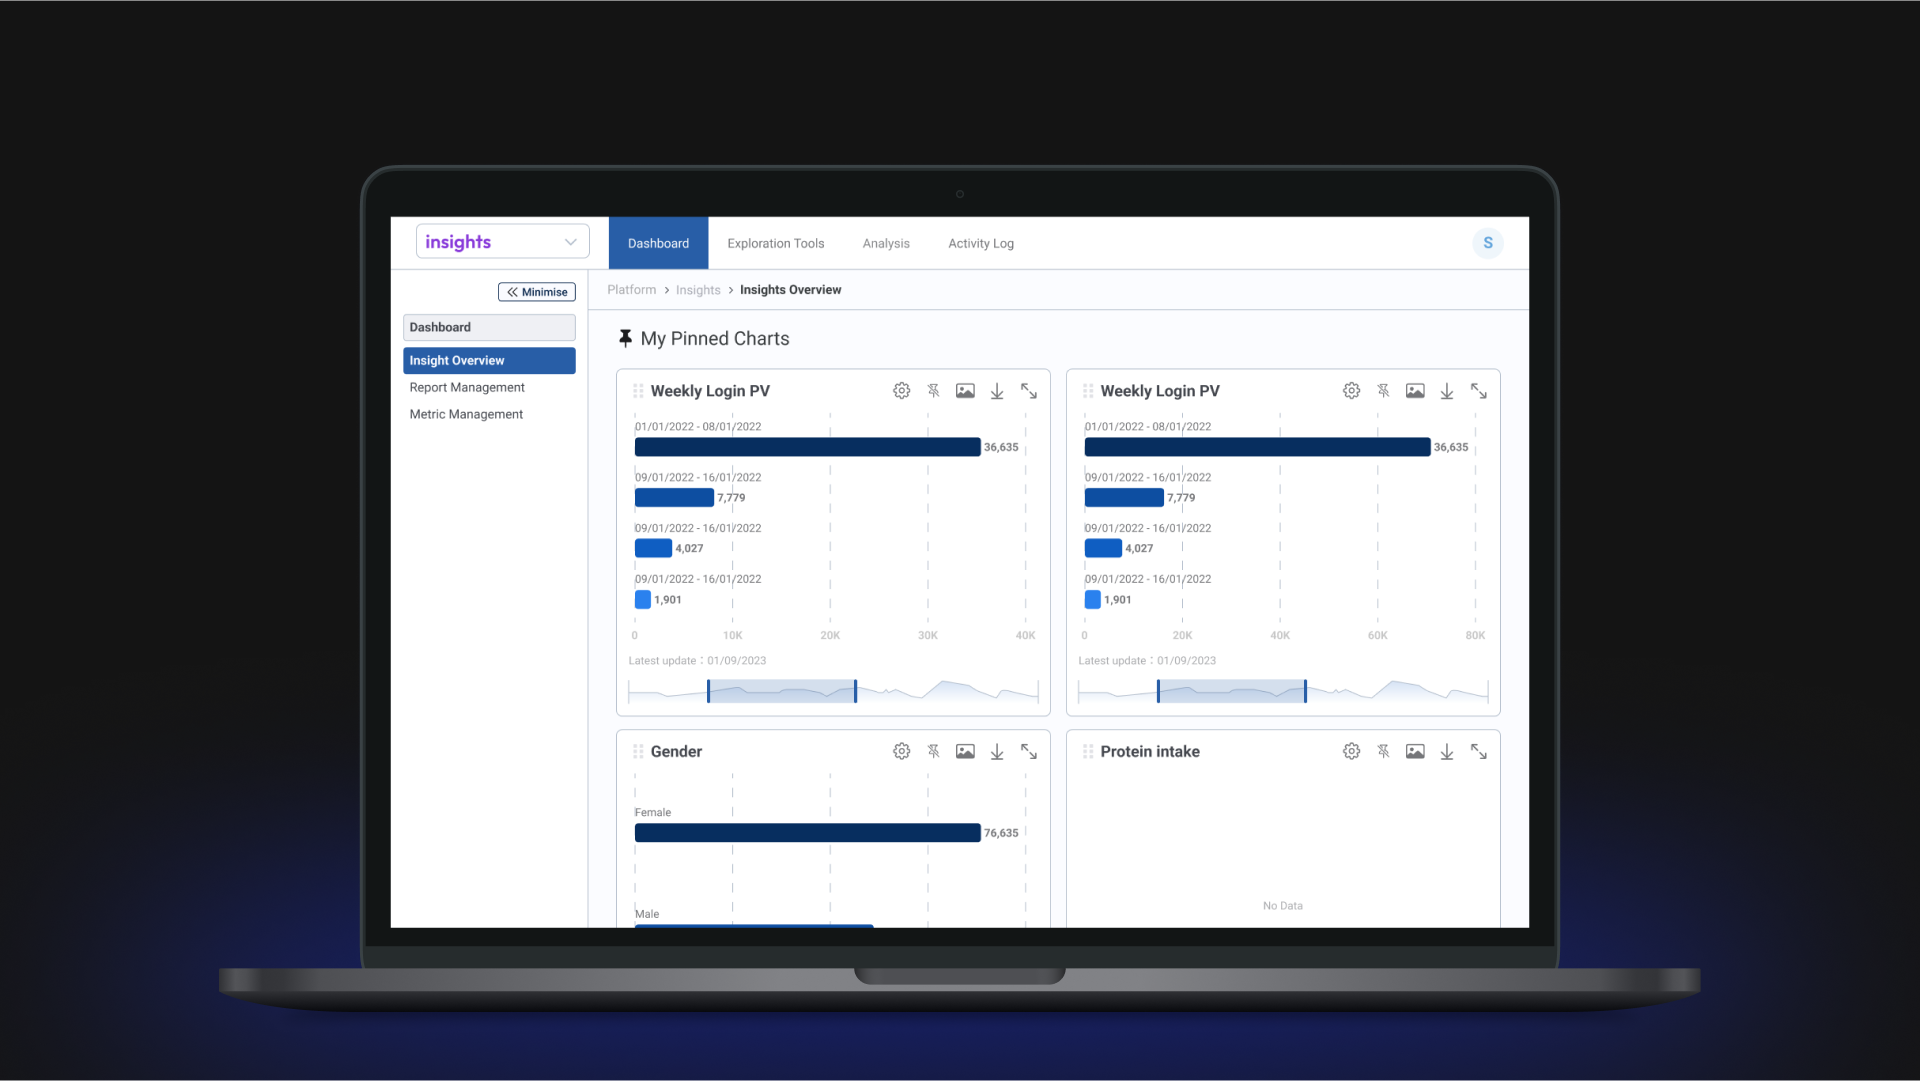
Client's Struggle
Client’s have difficulty accessing, understanding raw data tables, they require a lot of assistance to be able to report upwards.
How it helped
Now being able to access dashboards live, and directly from the platform, client is able to report upwards with confidence and clarity.